Lecture 3: Evaluating AI Models
In this lecture, we will learn how to evaluate AI models in a way that is familiar to clinicians.

By the end of this lecture, you should be able to interpret AI performance using concepts you already know from clinical medicine.
This includes understanding key evaluation metrics and applying them to clinical decision-making.

The most important message of this lecture is that evaluating AI follows the same logic as evaluating diagnostic tests.
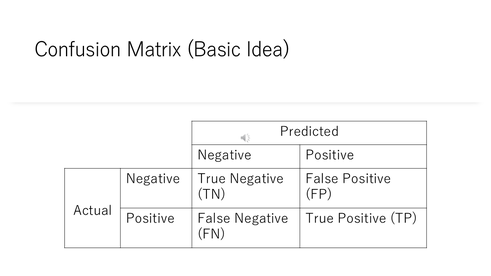
To evaluate an AI model, we use something called a confusion matrix.
It compares the model’s predictions with the true clinical outcomes.
There are four possible results: true positives, false positives, false negatives, and true negatives.
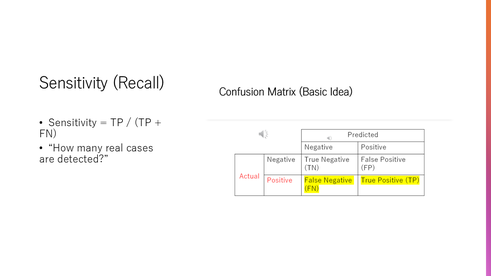
Sensitivity measures how well the model detects patients who actually have the disease.
In other words, it answers the question: How many true cases did we correctly identify?
Specificity measures how well the model correctly identifies patients who do not have the disease.
It answers the question: How many healthy patients were correctly classified?

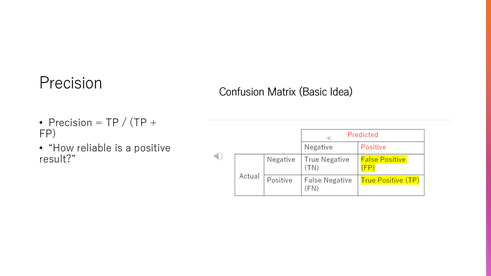
Precision tells us how reliable a positive prediction is.
If the model says a patient has a disease, precision tells us how often that is actually true.
There is often a trade-off between sensitivity and specificity.
If we try to detect every possible case, we may increase false positives.
The right balance depends on the clinical situation.

In cancer screening, we usually prioritize high sensitivity.
We want to detect as many cases as possible, even if it means some false positives.
Later, more specific tests are used to confirm the diagnosis.

The ROC curve shows how the model performs across different decision thresholds.
On the horizontal axis, we have the false positive rate, and on the vertical axis, we have sensitivity.
Each point on the curve represents a different threshold used to classify patients as positive or negative.
When we lower the threshold, sensitivity increases, but false positives also increase.
When we raise the threshold, false positives decrease, but we may miss true cases.
Therefore, the ROC curve illustrates the trade-off between detecting disease and avoiding false alarms.
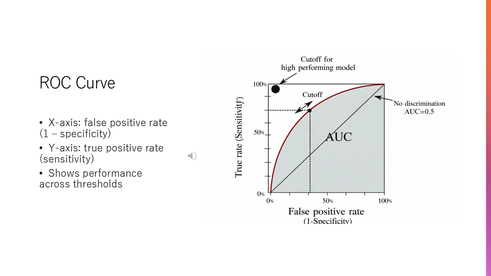
The area under the ROC curve, or AUC, summarizes the model’s overall performance.
A value close to one means excellent performance, while a value close to 0.5 means the model is no better than random guessing.

Even a model with a high AUC may not be clinically useful, because the balance between false positives and false negatives may not be appropriate for the clinical situation.
We must always consider how the model will be used in real clinical settings.

One common mistake is relying only on accuracy.
In many medical situations, accuracy can be misleading, especially when the disease is rare.
For example, if only 1% of patients have the disease, a model that always predicts “no disease” will be 99% accurate—but it fails to detect any true cases.
Therefore, accuracy alone does not tell us whether a model is clinically useful.
When evaluating AI, we must think clinically.
The key question is: what are the consequences of false positives and false negatives?

Evaluating AI models uses the same principles as evaluating diagnostic tests.
These metrics must always be interpreted in a clinical context.

